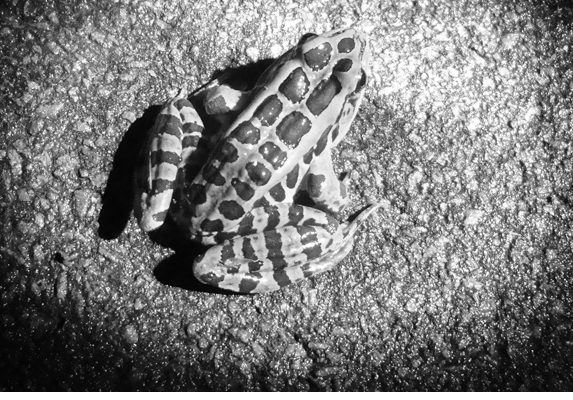
By the time this Gazette goes to print, the wood frog, wood cock, spotted salamander, spring beauty and ramp season will be over. Oh, those plants and animals will still be here—but they’ll be hunkered down in the grasslands, in the woods, under logs—until next spring. But these seasonal plants and animals, like the year-round flora and fauna of our fields and forests, require a wildlife habitat all year long. If we lose that habitat, we lose the plants and animals. Our local biodiversity and our quality of life would diminish accordingly.
Many of us know that when it comes to biodiversity, Gardiner is a landscape richly endowed; and even if we don’t think of it in those terms, the magnificent views tell the story. A way to protect this heritage for the future is to start with identifying—it’s hard to protect something if you don’t know what or where it is. Probably the best way to identify landscape elements is with a map. A GIS (Geographic Information Systems) map connects a database to the map image so that any amount of relevant data can be attached to the individual geographic elements.
An effort to identify local wildlife habitats began several years ago when volunteer groups in the towns of Gardiner and Shawangunk underwent ten-month training programs —Biodiversity Assessment Training or BAT—conducted by Hudsonia, Ltd. in partnership with the Hudson River Estuary Program. Participants learned to use remote sensing techniques involving a wide variety of maps including soil, topographic and aerial maps, and then follow up their habitat predictions with site visits or “ground-truthing.”
Subsequent to the original training, the towns of Gardiner and Shawangunk received an intermunicipal grant to map the habitats in both towns.
A team was formed to conduct more field trips and collect data. The data were then entered into a computer using the GIS mapping software, ArcGIS (also provided by the grant). This process is often referred to as digitizing—basically it means just drawing lines to delineate the different habitats on a computer map. The end result appears as many different colored blobs representing the different types of habitats. Now, after seven years, over 500 volunteer hours and 700 GIS digitizing hours on 64,000 acres (for both towns), the habitat maps are complete. Accessing and editing the main map file will require the special GIS software, but a “static” .pdf file—which uses free Adobe Reader—will soon be available from the towns’ websites.
In addition to identifying the habitats, the map will include a report with a detailed description of each habitat along with a list of the plants and animals likely to use the habitat. Knowing what plants and animals are likely to use a habitat is a primary reason for developing a habitat map system. In other words, confirm identity of the habitat, such as woodland pool, and we know that one or more species of mole salamanders is likely to use this area for breeding.The map reveals many interesting aspects about Gardiner’s wildlife habitats—such as those most abundant, like contiguous or un-fragmented forest—huge swaths of contiguous forests in the town provide habitat for certain song birds and large mammals which can’t survive in smaller woods. Many special habitats, some of which require a closer look for verification, were also discovered. These include kettle shrub pools, cool ravines and wet clay meadows, all of which support rare plants and animals.
